
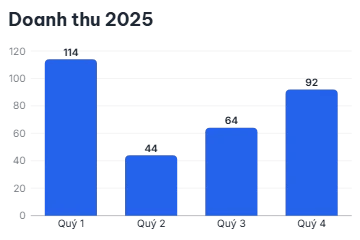
Find these elements in Library › Motion › Elements, section Charts & numbers. Click a tile to add it at the playhead, or drag it onto the timeline. Select the item on the timeline to change its options in the Inspector. Charts build up step by step: bars, slices, events and numbers each appear at their own cue, so you can match them to the voice-over. Numbers use the Vietnamese format by default (1.000,5).

Bar chart

Bar chart element
Vertical bars for each category and series grow up from the baseline one step at a time, with value labels rising alongside. Key options in the Inspector:
  • Data: The table of categories (rows) and series behind the chart; edit cells or paste a table.
  • Show values: A value label at each bar.
  • Show legend: A legend of the series.
When to use: Compare a few amounts side by side, such as revenue per quarter.

Horizontal bar chart

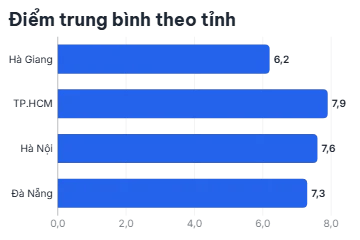
Horizontal bar chart element
Horizontal bars grow from left to right one step at a time, with the value at the end of each bar. Key options in the Inspector:
  • Data: The table of categories (rows) and series behind the chart; edit cells or paste a table.
  • Label side: Category labels to the left of the bars or inside them.
  • Show values: A value label at the end of each bar.
When to use: Rankings and lists with long category names, especially in 9:16.

Line chart

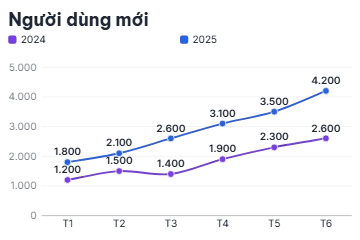
Line chart element
Each series draws on as a line at its cue and a dot pops at each value; you can fill the area under the line. Key options in the Inspector:
  • Data: The table of categories (rows) and series behind the chart; edit cells or paste a table.
  • Curve: Straight segments or a smooth curve through the points.
  • Area: Fill under each line.
When to use: Trends over time: prices, followers, temperatures.

Pie chart

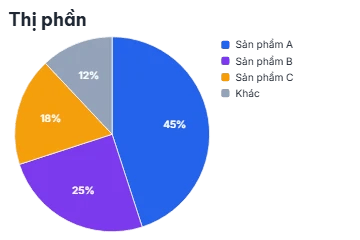
Pie chart element
Slices of the first series sweep in clockwise one by one, with a legend of the rows; as a donut it shows the total in the hole. Key options in the Inspector:
  • Data: The table of categories (rows) and series behind the chart; edit cells or paste a table.
  • Donut: Size of the hole as a share of the radius (0 = pie); a donut shows the total in the hole.
  • Labels: Text on each slice.
When to use: Shares of a whole, when there are only a handful of parts.

Histogram

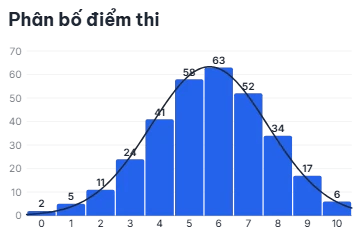
Histogram element
Bins grow from your data one by one; a bell curve can draw on top and a dashed reference line can drop in. Key options in the Inspector:
  • Data: The bins as rows; the first series holds the counts.
  • Curve: Bell curve: none, fitted to the bins, or from a mean and spread.
  • Reference: A dashed vertical line at a value, with an optional label.
When to use: Show how values are spread out, such as test scores or delivery times.

Waffle chart

Waffle chart element
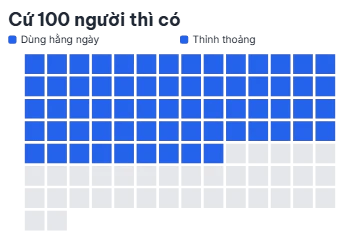
A grid of up to 1,000 units where each group fills its units row by row at its cue, with a legend of the groups. Key options in the Inspector:
  • Units: Units in the grid (1–1000).
  • Groups: Highlighted groups (up to 6) that fill units in order; their counts add up to at most the number of units.
  • Show legend: A legend of the groups.
When to use: Make a proportion easy to picture: “3 in 10 people…”.

Number counter

Number counter element
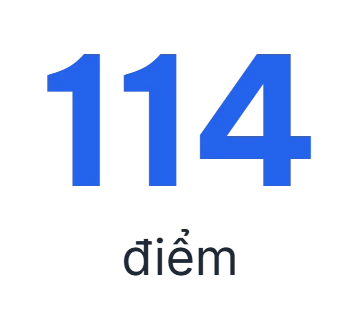
A number counts from one value to another at its cue, with a label under it; the number uses the Vietnamese format by default. Key options in the Inspector:
  • From: Value the count starts at.
  • To: Value the count ends at.
  • Format: Number format: Vietnamese (1.000,5) or English (1,000.5), decimals, prefix, suffix and short forms.
When to use: One big statistic the voice-over is talking about.

Progress

Progress element
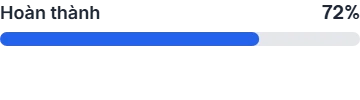
A bar or ring fills to a percentage at its cue while the value counts up, with a label. Key options in the Inspector:
  • Shape: A filling bar or a ring arc.
  • Value: Filled percent (0–100).
  • Label: Label text.
When to use: Goals, completion rates and battery-style levels.

Vietnam map

Vietnam map element
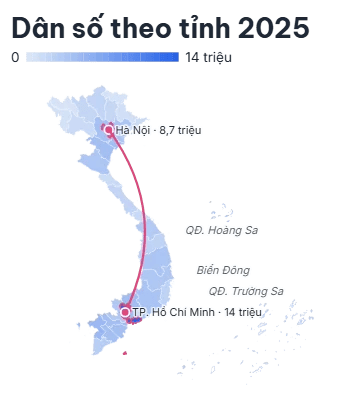
A map of the 34 provinces of Viet Nam (2025) coloured by a value per province, with highlighted provinces and flight paths; the national view always shows and names the Hoàng Sa and Trường Sa archipelagos. Key options in the Inspector:
  • Data: One row per province (names with or without diacritics, former provinces or codes); the first series holds the values.
  • View: The whole country with the archipelagos, or a north, central or south crop.
  • Arcs: Up to 4 flight paths that draw on at their cues, with a plane.
When to use: Regional data, travel routes and store locations across Viet Nam.

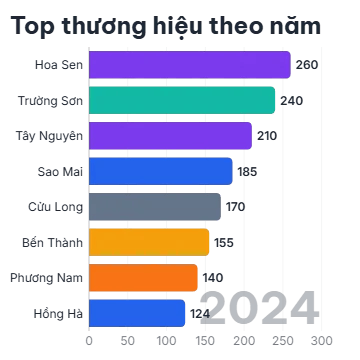
Bar chart race

Bar chart race element
Bars re-rank period by period and overtake each other as their values change, with the current period shown large. Key options in the Inspector:
  • Data: Rows are the entities (bar colour = row colour); each series is one period, named like “2019”.
  • Top n: Bars shown: the top N entities of each period.
  • Period seconds: Seconds between period steps.
When to use: Rankings that change over the years: brands, countries, channels.

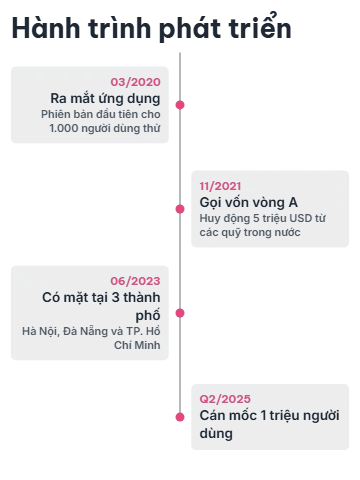
Event timeline

Event timeline element
Dated events along a vertical or horizontal line; at each event the line draws to its dot, the dot pops and its card slides in. Key options in the Inspector:
  • Events: Dated events in order (up to 12); each appears at its own cue.
  • Orientation: Vertical (for 9:16) or horizontal (for 16:9).
  • Side: Cards alternate sides of a centred line, or all sit after a line along the edge.
Ready-made tiles in the Library: Horizontal compact. When to use: History, company milestones and step-by-step stories.

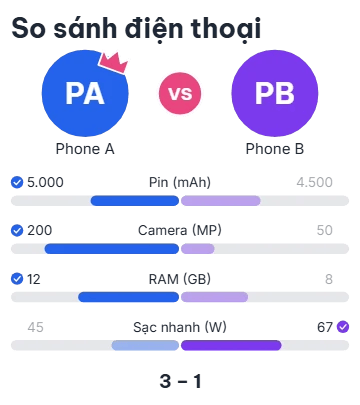
VS comparison

VS comparison element
Two named sides, with optional pictures, compared on up to 6 metric rows; the better value wins each row, and a tally and crown close the card. Key options in the Inspector:
  • Data: The two series are the sides; each row is one metric.
  • Better: Whether the higher or the lower value wins a row; the winning side gets a check mark.
  • Show tally: Rows won by each side (“3 – 1”) and a crown on the overall winner.
When to use: Product face-offs, before and after, this versus that.

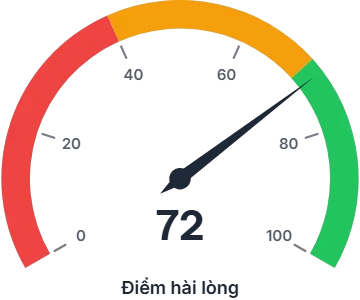
Gauge dial

Gauge dial element
A dial with coloured bands whose needle swings to the value at its cue and settles, the value counting with it. Key options in the Inspector:
  • Value: Value the needle sweeps to.
  • Bands: Up to 5 coloured bands along the dial.
  • Arc degrees: Dial sweep: 180 (semicircle), 240 or 270 degrees.
Ready-made tiles in the Library: Semicircle score. When to use: Scores, risk levels, speed or satisfaction ratings.